Introduction: When the Reference Leg Freezes
In process instrumentation, zero drift is the slow migration of a transmitter’s baseline away from its calibrated zero. Everything measured afterward carries that error. Frozen impulse lines produce one common form of it: when the fluid in a reference leg solidifies, the static head the device depends on changes, and the zero moves with it. Your heat tracing choice, whether electric, steam-jacketed, or self-regulating cable, decides whether that leg stays liquid, freezes partly, or blocks outright, and each outcome bends transmitter readings in a different direction.
A frozen reference leg rarely announces itself. The transmitter keeps transmitting; it just transmits the wrong number. Control loops, alarms, and safety interlocks then act on that number as if it were true. Restoring the correct zero, and holding it through a cold snap, depends less on repeated recalibration than on how the impulse line is traced and insulated.
This article covers four things: how a differential-pressure transmitter establishes its zero and why frozen fluid shifts it; which heat-tracing methods are used in the field and what drift signature each one produces; how to separate cold-leg drift from a genuine process change; and the design, insulation, and maintenance steps that keep impulse lines liquid through winter.
The Physics Behind Frozen Impulse Lines
A differential pressure transmitter measures the difference between two pressures. That difference depends on the hydrostatic column resting in each impulse line, so when the column changes for a reason unrelated to the process, the instrument reports a disturbance that is not there.
The sequence runs in seven steps.
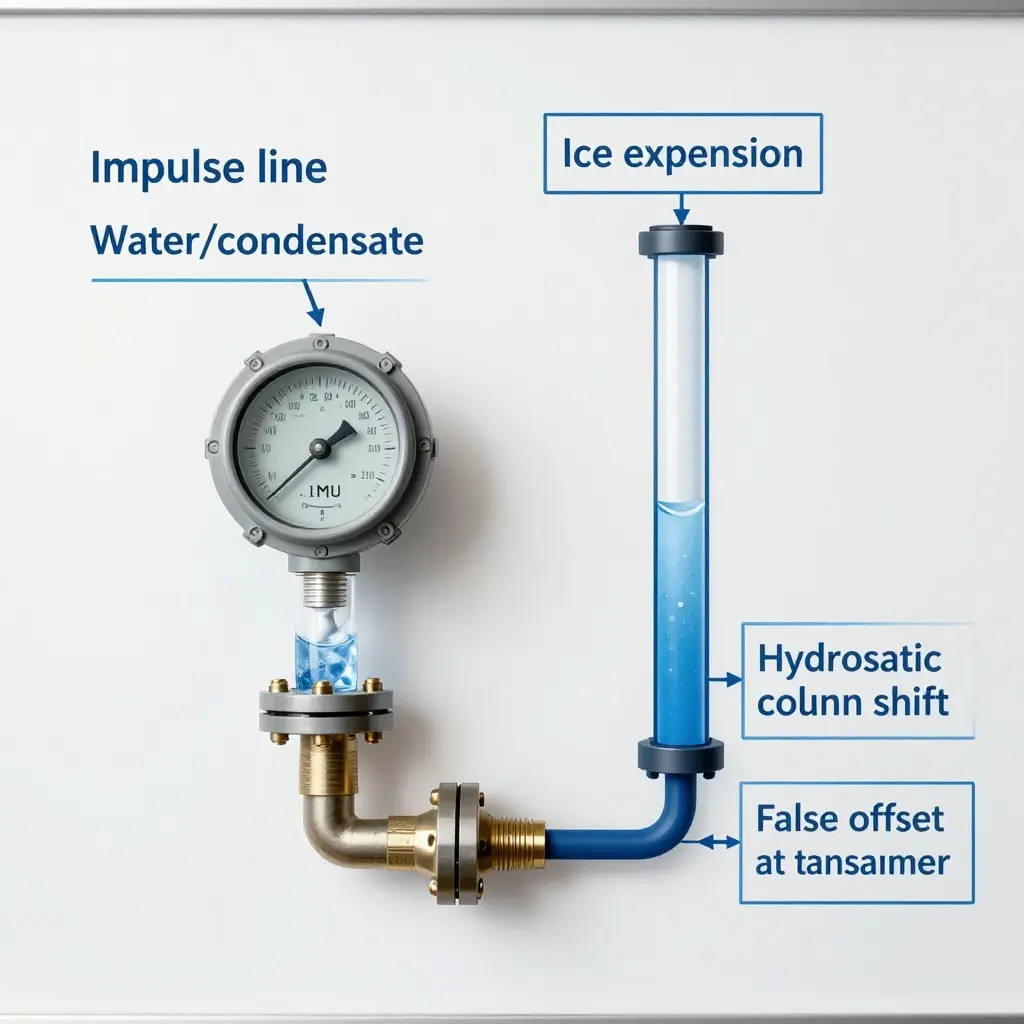
- Liquid becomes trapped. Water or condensate sitting in a sloped or vertical impulse line settles into a closed volume held between the process tap, the isolation valve, and the transmitter body.
- Temperature falls to the freezing point. As ambient temperature drops, the trapped fluid cools toward its phase change. What the fluid is matters: pure water freezes near 0 °C, while condensates and water-glycol mixtures shift that point up or down.
- Expansion begins. Water gains roughly 9 percent in volume as it turns to ice. In an open cup that is harmless. In a sealed, rigid tube it is not.
- The line generates pressure. The ice cannot push the tube walls outward, so the growing crystal structure loads the column and displaces any remaining liquid, bowing or cracking weak fittings.
- The hydrostatic column changes. The reference leg now holds a different effective density and height than it did when the loop was commissioned, so its hydrostatic pressure no longer matches the value the calibration assumed.
- The differential shifts. The transmitter subtracts one leg from the other, so any change on the reference side appears as a false offset in the measured differential.
- The offset persists. Until the ice melts and the column re-forms, the transmitter keeps reporting that constant error. The zero has drifted even though the process never moved.
Ambient temperature sets the timing and severity of the event. A slow seasonal decline freezes the line gradually; a sharp cold snap can lock it in within hours. Line slope decides where liquid pools and whether it drains away or sits in the danger zone. Fluid type governs the freeze point and the expansion ratio, which is why a line that behaves in one service can fail in another.
Drift is not the transmitter failing. It is the reference leg becoming a different, frozen physical system.
Heat Tracing Options and Their Effect on Impulse Line Stability
How you keep an impulse line warm decides what your transmitter sees. The table below compares the common choices and what each one does for freeze protection and zero drift.
| Tracing Method | Typical Temperature Control | Freeze Protection Reliability | Risk of Zero Drift | Best-Fit Applications |
|---|---|---|---|---|
| Steam tracing | Set by steam header pressure and trap condition; roughly 150-200 C, coarse and manual | High while steam is available, but drops sharply on trap failure or condensate backup | Moderate to high: uneven heating and sudden steam loss can boil or freeze the fill fluid | High-temperature, large-bore lines in plants with ample spare steam |
| Self-regulating electric heat cable | Automatic self-limiting output that responds to ambient; thermostat optional | High: stable output, easy redundancy, tolerant of partial power loss | Low to moderate: self-limiting action curbs overheating, but ambient-driven swings can still nudge the reading | Long outdoor runs and freeze protection where reliable power exists |
| Constant-wattage cable | Fixed output requiring an external thermostat or controller | Good when controlled, but hot spots appear if the cable overlaps or a controller fails | Moderate to high: over- or under-heating shifts line temperature and the reading | Predictable duty cycles and tightly controlled heated zones |
| Mineral-insulated (MI) cable | Precise control via a dedicated controller; very high power density and temperature capability | Very high: rugged, uniform, and tolerant of high watt density and heat | Low: stable, even heating holds the line at a consistent temperature | High-temperature, hazardous areas, critical lines, and steam-tracing replacements |
| Uninsulated or passive (no tracing) | None; the line simply follows ambient temperature | Low to none in cold climates; relies entirely on process heat | Very high: freeze/thaw plugging leads to full signal loss and severe drift | Only warm climates or lines that never approach freezing |
The columns are not independent. A tracing method with weak temperature control almost always pairs with high zero drift, because the impulse line temperature, not the process, becomes the variable your transmitter responds to. Choosing a stable, well-controlled trace is therefore a measurement decision, not just a freeze-protection one.
How Heat Tracing Choices Change Transmitter Readings
Heat tracing decides whether a transmitter tells the truth. The fill fluid in an impulse line reports accurately only while its own temperature holds steady. Change that thermal picture and the reading walks away from reality long before anyone notices in the control room.
Under-Tracing: The Freeze and the Drift
When a heat trace is undersized, spaced too sparsely, or simply left off, the fluid inside the impulse lines cannot hold its temperature against the cold. The vulnerable spots are the ones with the least coverage: a long horizontal run, a deadleg, or a fitting tucked behind insulation. There the fill fluid freezes locally while the rest of the line stays liquid.
A partial freeze changes the effective pressure the transmitter sees. The frozen plug isolates the measurement point, and as ambient temperature swings the trapped fluid expands and contracts against a fixed boundary. The signal wanders even when the real process has not moved. That wander is zero drift, and it shows up long before a full blockage kills the reading entirely.
Over-Tracing: When Too Much Heat Backfires
A trace that runs too hot can boil or vaporize the fill fluid. Once liquid turns to vapor somewhere along the impulse line, the hydrostatic relationship between the process and the transmitter breaks. The vapor pocket adds its own pressure contribution, so the device reports an offset that has nothing to do with the actual process. Worse, it can be unstable: vapor bubbles form and collapse, producing a jumping, noisy signal that mimics real process movement.
The Controlled Middle: Isothermal and Stable
A properly designed and controlled trace holds the impulse lines isothermal: one steady temperature above ambient and safely below the fill fluid’s boiling point. The fluid stays liquid everywhere, density stays constant, and the only pressure the transmitter responds to is the one it was built to measure. The reading stays stable and zero stays where it was calibrated.
| Scenario | What happens to the fill fluid | Effect on transmitter readings |
|---|---|---|
| Under-traced | Localized freezing creates solid plugs | Erratic, wandering zero (zero drift) |
| Over-traced | Fill fluid boils, forming vapor pockets | Offset added, noisy or jumping signal |
| Controlled | Fluid held isothermal, single liquid phase | Stable reading, zero holds true |
Key Takeaways
- Heat tracing sets the thermal state of the fill fluid, and that state, not the process alone, shapes what the transmitter reports.
- Under-tracing freezes the fluid unevenly, which produces erratic zero readings and persistent zero drift.
- Over-tracing boils the fluid, and the vapor pockets inject their own offset and noise.
- A controlled trace holds the line isothermal and keeps the zero trustworthy. The goal is steady heat, not maximum heat.
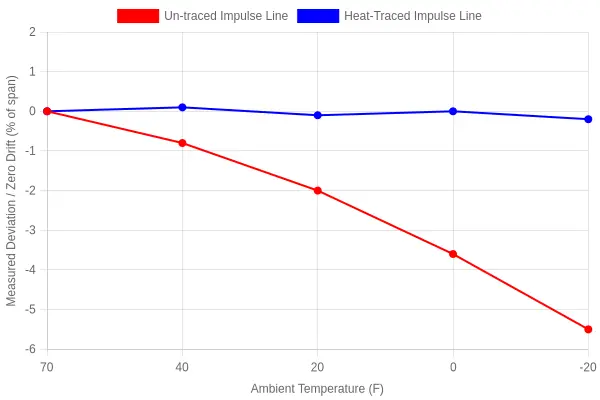
Chart Data
| Ambient Temperature (F) | Un-traced Impulse Line (% of span) | Heat-Traced Impulse Line (% of span) |
|---|---|---|
| 70 | 0.0 | 0.0 |
| 40 | -0.8 | 0.1 |
| 20 | -2.0 | -0.1 |
| 0 | -3.6 | 0.0 |
| -20 | -5.5 | -0.2 |
As ambient temperature falls, the un-traced impulse line drifts sharply negative, losing roughly 5.5% of span by -20 F, while the properly heat-traced line holds near zero across the entire range.
Selecting the Right Heat Tracing for Stable Readings
Heat tracing on an impulse line is about holding the fluid in a state where the reading stays honest, so the transmitter measures the process instead of the weather. When the tracing is wrong, the clues are small offsets that look like calibration drift but actually come from temperature. Left alone, those offsets harden into zero drift that never fully clears.
Sizing tracing wattage
Size from the worst case, not the mild day. The required wattage has to cover the heat lost through insulation, carry a margin for wind and cold snaps, and still leave the fluid below its degradation temperature. Undersizing creates cold pockets where impulse lines stall; oversizing cooks the fluid and introduces its own bias. The goal is a wattage that holds the line steady through the coldest realistic night, nothing more.
Setting control set-points
Choose a set point a few degrees above the highest expected freeze or dew point, and safely below the temperature where the fluid breaks down. A tight, stable band keeps transmitter readings steady. A wide band lets the line cycle back and forth across the phase change, and every cycle nudges zero drift a little further from true.
Steam versus electric
Steam tracing is inexpensive where a header already exists, but it resists fine modulation and often runs hotter than intended. Electric tracing is precise, easy to zone, and simple to control point by point. Where reading stability matters most, the modulation and repeatability of electric usually win; where supply is already on site, steam wins on operating cost.
Applying insulation
Insulation is half the system, not an accessory. Gaps, damaged jacketing, and bare valves or flanges leak heat and defeat otherwise good tracing. Continuous, well-sealed insulation keeps the set point achievable at lower wattage and cuts cycling, which in turn lowers the odds of drift.
Verifying after commissioning
Confirm actual surface temperatures with a thermal camera, check wattage draw against design, and watch the transmitter across a full cold cycle. Verification is what separates a system that reads true from one that drifts unobserved.
Selection criteria
- Define worst-case ambient, wind, and exposure for each line.
- Identify the fluid’s freeze, dew, or viscosity limit.
- Calculate heat loss using the specified insulation.
- Select wattage with a defined safety margin.
- Choose steam or electric based on heat source and control needs.
- Set a control band above the limit and below degradation.
- Specify insulation continuity, including valves and fittings.
- Verify performance after commissioning, then recheck seasonally.
| Criterion | Steam tracing | Electric tracing |
|---|---|---|
| Control precision | Coarse; hard to modulate | Fine; zone by zone |
| Response time | Slow thermal lag | Fast, near-instant |
| Best suited for | Sites with existing steam headers | Remote or precisely controlled points |
| Overheating risk | Higher near traps | Lower with a correct set point |
| Maintenance | Trap and leak upkeep | Element and controller checks |
| Effect on zero drift | Higher variance from cycling | Lower, steadier, less drift |
Getting Reliable Readings Through Better Heat Tracing
The heat tracing decisions you make on an impulse line decide whether the line freezes and whether the transmitter drifts at zero. A frozen line traps or compresses the process fluid, the pressure signal reaching the transmitter stops reflecting reality, and the device reports a false zero while the actual process keeps moving. Selection sits in the middle of that chain: the type of tracing, the watt density, the thermostat setpoint, and the insulation details decide whether the line stays above the dew point. Mechanism explains the risk, selection controls the risk, and the outcome shows up in your transmitter readings.
- Freeze protection comes first. Trace design, insulation, and setpoints should keep every impulse line comfortably above freezing so frozen impulse lines never distort the signal.
- Zero drift is a symptom, not a mystery. When a blocked or frozen line causes misleading low readings, the fix lies upstream in the heat tracing setup, not in the electronics.
- Selection drives performance. Match trace type and watt density to the fluid, ambient conditions, and line length, then verify it actually works in the field.
- Validate and maintain. Regular checks, insulation inspections, and controller calibration keep transmitters honest across every season and cold snap.
Treat heat tracing as a measurement instrument in its own right: design it deliberately, commission it carefully, monitor it continuously, and reliable readings will follow.
Zero Drift on Frozen Impulse Lines: How Heat Tracing Choices Change Transmitter Readings
The Quiet Signal That Lies
Every so often a transmitter starts reporting something the process contradicts. Flow reads low, pressure creeps toward zero, and the control room starts asking questions. Before blaming the sensor, check the thin tube between the process and the instrument: the impulse line.
When that line freezes, the fluid inside stops behaving like a fluid. Trapped between the process tap and the transmitter, it stiffens into a rigid plug, and the pressure it delivers is no longer the pressure you care about. The symptom is zero drift. It is the same problem crews face when they keep fire trucks ready in freezing weather.
Why a Frozen Line Produces Zero Drift
A liquid-filled impulse line normally transfers pressure almost instantly, because liquid is effectively incompressible. Freezing breaks that assumption. When the medium solidifies, or the sealing fluid expands within a closed volume, the hydraulic link between the process and the transmitter is altered. The instrument keeps faithfully reporting whatever pressure it sees, but that pressure is now manufactured by expansion and trapped vapor rather than by the process itself.
Cold weather often produces two failure modes at once:
- A solid plug that blocks pressure transmission entirely, dragging the reading toward a false zero.
- A trapped vapor pocket that compresses and swells, adding a phantom offset that drifts with ambient temperature.
Either way, the reading loses its connection to reality, and operators may chase a process problem that does not exist.
Heat Tracing Choices and Their Consequences
The fix is almost always thermal: keep the line warm enough that the medium stays fluid. But not all heat tracing behaves the same way, and the method you pick changes how much the reading can still drift.
| Tracing method | Typical behavior | Risk to watch |
|---|---|---|
| Steam tracing | High, even heat output | Overheating, condensate management |
| Electric resistance | Steady, predictable wattage | Uniformity along long runs |
| Self-regulating cable | Output rises and falls with temperature | Startup current, aging drift |
Self-regulating cable is popular because it throttles its own output as the line warms, but even a well-specified cable fails if the insulation is wet or the sensor is placed badly. The tracing is only as good as its coldest, weakest point.
Matching the Tracing Method to the Application
Selecting a tracing solution is a bit like a rider choosing protective motorcycle fairings against rain, grit, and wind: the point is to shield the line from the environment it actually lives in. A line exposed to coastal wind is a different problem from one buried in a heated rack. Match the solution to the exposure, not to the catalog.
Commissioning and Verification
Selection is only half the job. A tracing system has to be commissioned so every segment reaches its set point, verified with a thermal survey, and audited after the first cold snap. Treating it as a capital decision, the way businesses evaluate new vehicles for a fleet, keeps the focus on life-cycle value rather than sticker price.
Conclusion
Zero drift on a frozen impulse line is rarely a mystery once the physics is clear: a sealed volume, an expanding medium, and a transmitter doing its job. Heat tracing decides whether that drifting reading ever reaches the control room. Choose the method deliberately, insulate it well, and verify it in the field, and the numbers on the screen will match the process they claim to measure. When aging equipment reaches the end of its useful life, clearing it out is its own small project, not unlike turning an old asset into ready cash instead of letting it gather dust.